Observability
Answers one question honestly: is Node0 working right now, and if not, does a human need to know.
296 targets, 0 down · 387 rules, 357 alerting · 15 generated dashboards
What this layer is for #
Ceph’s replication and a firewall’s failover state can both behave correctly for months while nobody watches. This layer exists because the opposite happened four times inside the same 24 hours, and somebody looking for something else found each one.
On 20260906 a backups thread wrote up a single day. Two Ceph hosts, ceph1 and ceph8, had hung for ten hours with chassis power on, network links up and their system journals empty. Four Arista switches sat at their overheat shutdown threshold. A fixed fan-speed override, set a few days earlier for noise, had disabled the fan algorithm. A 12 TB Ceph disk had been dead for 38 hours, with only the drive’s own SMART banner, reading PASSED, available to ask. A UPS service event at 17:53 dropped rack 3 and rebooted both of its switches and seven hosts. Two of those hosts had no management controller and did not come back (lesson 5.6 ). None of it paged anyone.
The brief’s closing section shaped everything after it. For each failure it named the signal that already existed, rather than proposing new instrumentation. Those signals were a management-controller event log entry, a PAUSE-frame counter on a switch port, an OSD count and a power-daemon event. The data was already on the wire, and nobody was reading it.
How it is built #
An alarm that runs through the machine it watches is not an alarm. Every container in this layer runs on unraid1 except the one that pages. The notification server, ntfy, runs on core2, and that placement is the most load-bearing choice in the layer.
The build ran in phases from that same evening. Phase 1 stood up eleven containers on unraid1: Prometheus, Alertmanager, Grafana, Loki, VictoriaMetrics, Alloy and five purpose-built exporters. Phase 2, over the next day, put a metrics exporter, a log agent and a notifier on every host family: NixOS, Debian, Ceph, Proxmox, Unraid and Windows. Phase 3, to 20260914, reached the devices with SNMPv3 on the UPS cards and the PDUs, management-controller event logs polled in-band from core1, and switch syslog forwarding. The drawing below follows one page from the rule that fires to the phone.
Nothing is scraped from a hand-written list. A device in NetBox needs an active status and a field naming its exporter class. A discovery service turns that into scrape targets every five minutes, and it caches its last good result, so an inventory outage cannot empty the target list.
A live count on 20260921 read 296 targets with none down, 41 rule groups and 387 rules, 357 of them alerting. By severity those alerting rules are 77 critical, 259 warning, 20 info, and one watchdog, which is the permanent heartbeat.
Grafana, v12.1.0, answered healthy on 20260920. The repository carried 15 dashboards on 20260921, organised by the question being asked rather than by data source. They are generated from code, with a check flag that evaluates every panel query live, because a panel whose query has stopped returning data looks the same as a panel with nothing to report.
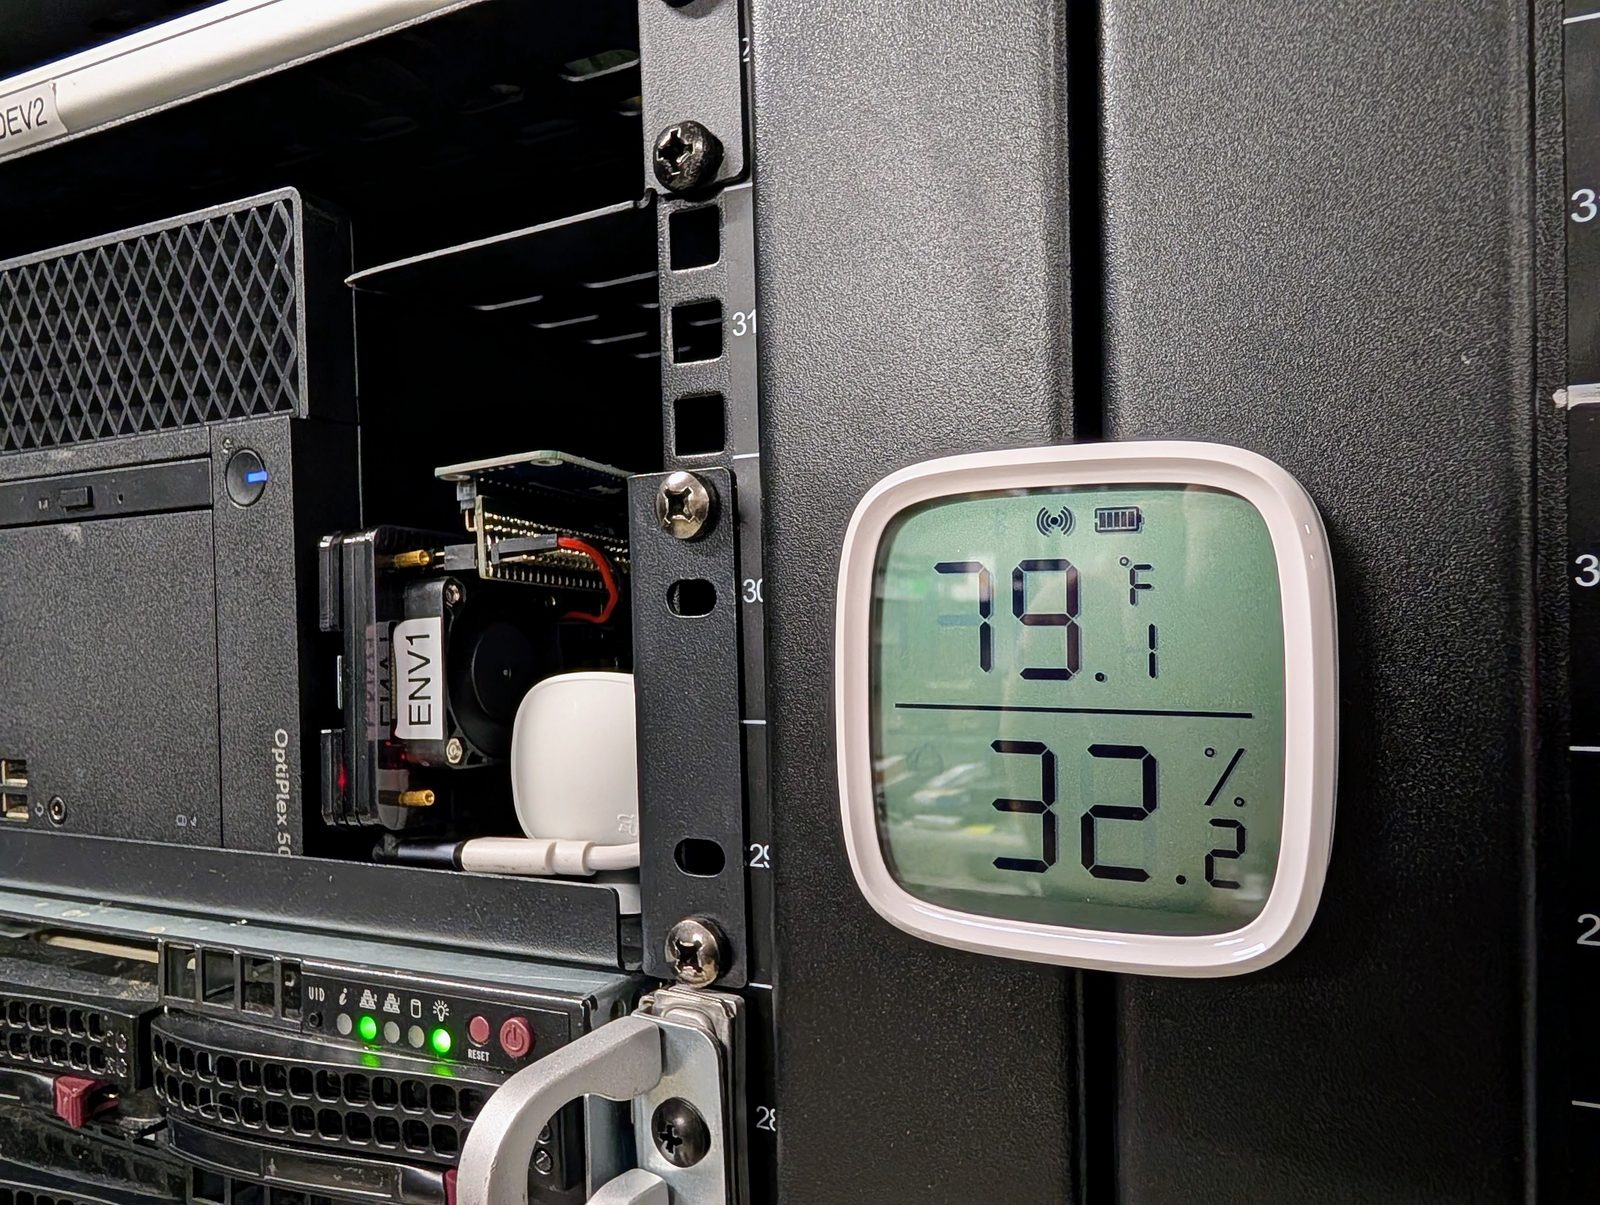
Two of those dashboards live on the wall. One small computer drives a display on top of racks 2 and 3 today, with rack 1’s still to come, one dashboard per rack showing the state of what is in it, and the whole of Node0 on the same screens, so a person walking into the room reads the site’s state at a glance before touching anything, and a light that is the wrong colour above a rack is noticed on the way past rather than found in a query. The same dashboards are Grafana, so the same view is there from anywhere over the remote-access mesh; the wall is for the room, the phone and the laptop are for everywhere else. For what it costs, a Pi and a display, it is one of the most used pieces of the layer.
The observers are named for their trust posture, which is the convention worth stealing. A probe records from inside the fabric and keeps its own account of what the network did, rather than shipping it somewhere that breaks when the network does. A canary sits at the second site and is built to die first. An outpost is outside the network entirely and sees what the internet sees.
| host | role | form | where it sits | OS |
|---|---|---|---|---|
| probe1 | in-fabric blackbox recorder | Mac mini, Late 2012 | rack 2, shelf-mounted | NixOS |
| probe2 | second in-fabric vantage point | Mac mini, Late 2014 | rack 2, shelf-mounted | NixOS |
| canary1 | resident-experience canary | ASUS Chromebook Flip | a second home nearby, behind a one-way boundary | NixOS |
| outpost1 | outside-in vantage point | Hetzner cloud instance | Germany, off site | Debian |
| wallboard1 | Grafana kiosk driving the two rack-top displays that are up, racks 2 and 3; to serve rack 1’s when wallboard2 takes over 2 and 3 | Raspberry Pi 4B | rack 2 | Debian 13 |
| wallboard2 | planned, not built as of 20260922; will drive the displays on racks 2 and 3 | n/a | rack 2 | n/a |
| unraid1 | hosts the monitoring containers; belongs to the storage layer | Supermicro 4U | rack 2 | Unraid |
| core2 | hosts ntfy and both dead-men; belongs to the bootstrap layer | small x86 laptop | in fabric | NixOS |
The decisions #
20260906: notifications leave through a box that is not the one being watched #
Workload. Delivering a page when something is wrong. Requirement. The path must survive the failure of the thing it reports on. On 20260905, the day before the founding brief, unraid1 was itself dark for hours with nothing said. Choice. ntfy runs on core2, never on unraid1, on its own public address with no shared front end, and each host gets a publish token that can write and never read. Notifications are tiered by topic, so a phone can be loud for one and quiet for another: a dead-man topic that only ever carries the silence of the stack, an alerts topic for the paging rules, and an apps topic for what the applications and jobs have to say; the alerts topic is due to split into alerts and critical. Accepted trade-off. A second machine to maintain. A phone on the home network still reaches the notification server through unraid1’s reverse proxy, so an unraid1 outage delays that phone’s page until it falls back to mobile data. Verified. By the dead-man test below, which stopped the metrics engine on unraid1 and still got a page from core2, and by the real silence of 20260911, which only core2 noticed.
20260906 and 20260920: every rule names its runbook and who acts on it #
Workload. Turning a firing alert into an action. Requirement. Whoever reads it, human or agent, must know without judgement whether to act. Choice. Every alerting rule, by a convention of 20260906 enforced from 20260920, carries three labels: an authority value (diagnose-only, page-human, remediate-safe), a pointer to the runbook that covers it, and a first diagnostic command. On 20260920 that read 272 diagnose-only, 80 page-human, 1 remediate-safe, and none unlabelled. Accepted trade-off. The convention arrived partway through and was not back-filled, so 41 rules carried no authority label until an audit found them. Verified. The gap was closed that evening, and CI now refuses a rule missing any of the three.
20260906 and 20260911: silence is the signal, and the switch is proven by stopping it #
Workload. Noticing that the stack itself has stopped talking. Requirement. A check that does not depend on the alerting path working. Choice. Alertmanager posts a permanent heartbeat alert to core2 every minute, and core2 pages if it goes quiet for about ten minutes. A second, independent dead-man watches canary1 the same way, because something behind a one-way boundary can report a problem but can never report its own death by going quiet. Accepted trade-off. The live test stopped the metrics engine and timed the page. It produced 13 minutes 5 seconds rather than the intended 10, because a delayed-resend setting kept the heartbeat’s last value alive for three minutes after it had stopped. That gap was still open on 20260920. It is accepted, because the page still arrives and three extra minutes on a check of the alerting path itself does not change what anyone would do; shortening it is still planned. Verified. By causing it, and then for real. On 20260911 Prometheus and Alertmanager both stayed up, recording a healthy heartbeat, while the webhook to core2 had stopped arriving; lesson 2.11 counts 98 minutes with no alert delivered. The stack looked fine and the alarm failed silently. Only the second machine noticed.
20260907: an external check that pages when the monitoring stops reporting #
Workload. Noticing that core2, the machine every page travels through, has gone dark. Requirement. A vantage point with no dependency on Node0. Choice. outpost1, a rented instance in Germany, probes the notification server and, if it stops answering, sends mail by a path that never touches the site. The same host scans the public address range from outside, against a committed list of what should be reachable. It proves it can see a known reference target first, so a broken scanner and a clean network cannot be confused. Accepted trade-off. A dark core2 is noticed by email rather than by a page, which is slower, and there is a monthly bill for a machine that does nothing else. Verified. End to end on 20260907.
What it cost #
Replacement costs are not yet researched, and purchase prices are not published; the expensive part of observability at this size was not the hardware.
What broke #
- Lesson 2.1 , The day four failures went unnoticed, and none of them paged anyone. The founding day, and the decision to build the first alerts from signals that already existed.
- Lesson 2.6 , A monitor that logs into the thing it watches becomes part of the fault it reports. A poller opening an SSH session every 15 seconds starved the UPS driver processes on that host, faking a rolling failure across all four units.
- Lesson 2.7 , Fifty-three containers, four probes, and a monitoring tool with zero monitors configured. A coverage pass on 20260907 found that everything built so far watched infrastructure, not the services Node0 exists to provide.
- Lesson 2.11 , A folder permission left from a partial deploy silenced the entire alerting path. The alerting engine’s own self-check could not fire, because the credential it needed to send that alert was the thing that had been locked away.
- Lesson 2.17 , Forty-one of three hundred and forty-seven alerting rules carried no instruction for whether to act. A convention adopted midway needs a back-fill pass, then a test that makes the omission a build failure rather than a memory exercise.
State on the day #
The layer was healthy on 20260920. Every rule file had a test file, both dead-men were running, the dashboards regenerated cleanly, and the three alerts firing were all known: two long-accepted DNS consistency warnings and the permanent heartbeat. Nine inhibition rules keep one cause from arriving as a flood, so a reboot of unraid1 is one page rather than forty. Two rules govern silences: none may name a device class instead of a reason, and every one carries an expiry.
Closed on the capture day itself, and marked as such: the 41 alerting rules with no authority label, labelled by Bosun that evening; the guest backup job Bosun added the same evening is told on the agents page .
Open on 20260920, updated 20260922: the displays on top of racks 2 and 3 are up, both driven by wallboard1; rack 1’s is not, and wallboard2 is not built. When it is, wallboard2 takes racks 2 and 3 and wallboard1 moves to rack 1. Monitoring refinements sit on Christoph’s in-motion list for the following week or two, and the dead-man’s three-minute timing gap has since been closed: its path was caused end to end, to the phone, on 20260927. The service coverage pass opened on 20260907 was closed by 20260922. Every service node0 provides is written down in one of three states: answered by its own metric or API check, probed with a body check by decision, or port-only or absent and known. A new service gets its row in the catalogue in the same change, because a service nobody has listed can fail with none of this noticing, the same shape of silence the layer was built to end.
Source: node0 as-built v0.1, section 3.9. Sanitized: checklist v0.1, 20260921; voice pass 20260921. Capture of 20260920; the private site keeps changing, this page does not. Part of oznog.com/node0.